Description of the WHU Building Dataset
We manually edited an aerial and a satellite imagery dataset of building samples and named it a WHU building dataset. The aerial dataset consists of more than 220, 000 independent buildings extracted from aerial images with 0.075 m spatial resolution and 450 km2 covering in Christchurch, New Zealand. The satellite imagery dataset consists of two subsets. One of them is collected from cities over the world and from various remote sensing resources including QuickBird, Worldview series, IKONOS, ZY-3, etc. The other satellite building sub-dataset consists of 6 neighboring satellite images covering 550 km2 on East Asia with 2.7 m ground resolution.
1. Aerial imagery dataset
The original aerial data comes from the New Zealand Land Information Services website. We manually edited Christchurch's building vector data, with about 22,000 independent buildings. The original ground resolution of the images is 0.075m. Due to the size of the aerial imagery (about 25G), we provide two methods to download the data. It can be downloaded from our website or from the Linz official website:
https://data.linz.govt.nz/layer/51932-christchurch-post-earthquake-01m-urban-aerial-photos-24-february-2011/.
we provide manually edited shapefile corresponds to the whole area.
We also down-sampled the most parts of aerial images (including 18,7000 buildings) to 0.3m ground resolution, and cropped them into 8,189 tiles with 512×512 pixels. The shapefile is also rasterized. The ready-to-use samples are divided into three parts: a training set (130,500 buildings), a validation set (14,500 buildings) and a test set (42,000 buildings).
According to the order of cropping, you can recover the original image from tiles.
Training area (blue box): 64×74=4736 tiles (Width × Height)
Evaluation area (orange box): 14×74=1036 tiles
Test area (two red boxes): 17×42+23×74=2416 tiles (part1 + part2)

Download:
1. Dataset with labels in Raster format.
2. Dataset with labels in COCO format(0.2 meter).
3. The whole aerial imagery and corresponding shapefile.
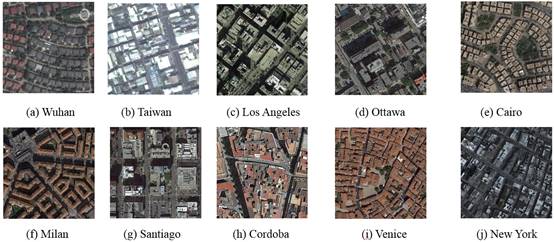
2. Satellite dataset I (global cities)
One of them is collected from cities over the world and from various remote sensing resources including QuickBird, Worldview series, IKONOS, ZY-3, etc. We manually delineated all the buildings. It contains 204 images (512 × 512 tiles with resolutions varying from 0.3 m to 2.5 m). Besides the differences in satellite sensors, the variations in atmospheric conditions, panchromatic and multispectral fusion algorithms, atmospheric and radiometric corrections and season made the samples suitable yet challenging for testing robustness of building extraction algorithms.
Download:
Satellite dataset I (113M).
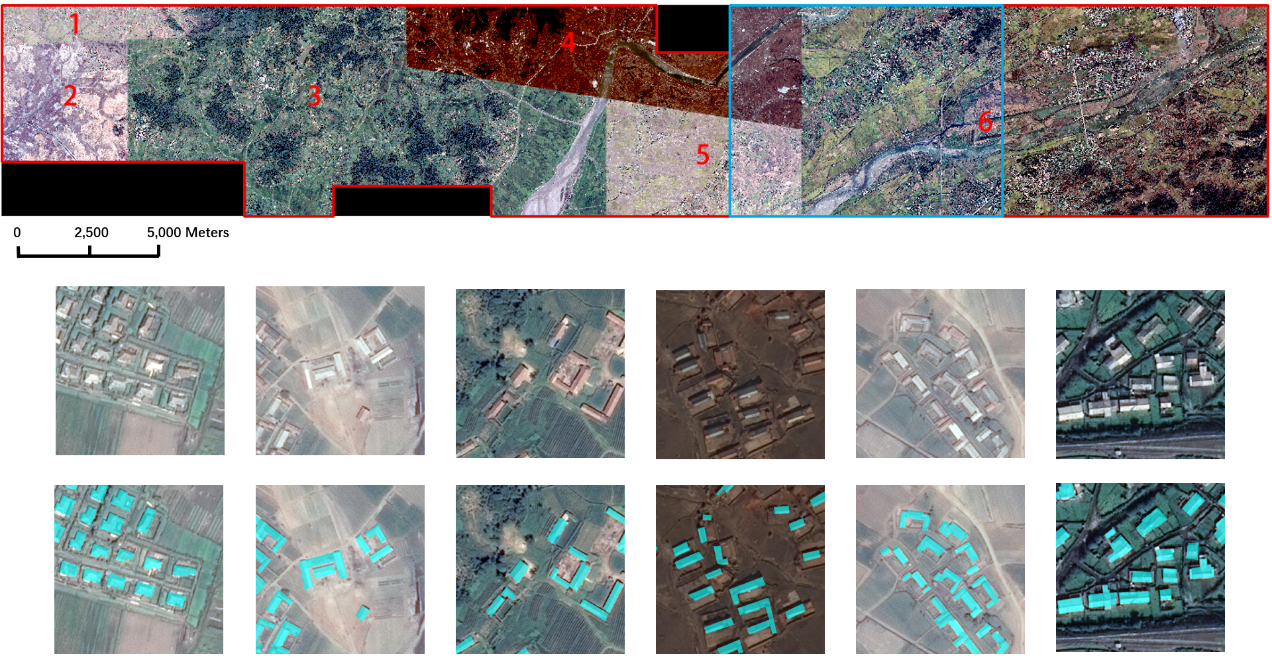
3. Satellite dataset Ⅱ (East Asia)
The other satellite building sub-dataset consists of 6 neighboring satellite images covering 860 km2 on East Asia with 0.45 m ground resolution. This test area is mainly designed to evaluate and to develop the generalization ability of a deep learning method on different data sources but with similar building styles in the same geographical area. The vector building map is also fully manually delineated in ArcGIS software and contains 34085 buildings. The whole image is seamlessly cropped into 17388 512×512 tiles for convenient training and testing with the same processing as in our aerial dataset. Among them 25749 buildings (13662 tiles) are separated for training and the rest 8358 buildings (3726 tiles) are used for testing.
Training area:186×54+67×54=13662 (part1+part2)
Test area: 69×54=3726 (Width×Height) (shape files are refined and updated on 12/12/2018)
Download:
Satellite dataset Ⅱ (13G)
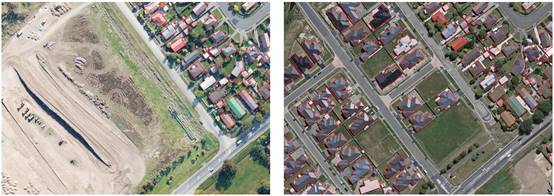
4、 Building change detection dataset
Our dataset covers an area where a 6.3-magnitude earthquake has occurred in February 2011 and rebuilt in the following years. This dataset consists of aerial images obtained in April 2012 that contains 12796 buildings in 20.5 km2 (16077 buildings in the same area in 2016 dataset). By manually selecting 30 GCPs on ground surface, the sub-dataset was geo-rectified to the aerial dataset with 1.6-pixel accuracy. This sub-dataset and the corresponding images from the original dataset are now openly provided along with building vector and raster maps.
(Updates 2018/12/12) We refined the vector shapes and provided a new 2012 dataset named “A_training_aera_before_change” for training a CNN building extraction model for the scene before changes. For a 2016 CNN model, you could use the dataset provided in section1.3 “The cropped image tiles and raster labels (recommended to use, 5G)” for training. Hence, the two 100% overlapped datasets, named “after_change” and “before_change” respectively, could be fully utilized for test the effects of change detection algorithm.
Download:
Building change detection dataset (5.43G).
If you use our dataset, we recommend you might cite our work:
季顺平. 智能摄影测量学导论[M],科学出版社,2018年4月. (in Chinese)
Or:
Shunping Ji, Shiqing Wei, Meng Lu, Fully Convolutional Networks for Multi-Source Building Extraction from An Open Aerial and Satellite Imagery Dataset [J]. IEEE Transactions on geoscience and remote sensing, 2018. DOI: 10.1109/TGRS.2018.2858817.
Updated: 2024/7/20
Shunping Ji
jishunping@whu.edu.cn